pytorch profiling
2022. 9. 24. 14:31ㆍAI/Pytorch
모델의 병목을 파악할때 유용하다.
https://tutorials.pytorch.kr/recipes/recipes/profiler_recipe.html
PyTorch 프로파일러(Profiler)
이 레시피에서는 어떻게 PyTorch 프로파일러를 사용하는지, 그리고 모델의 연산자들이 소비하는 메모리와 시간을 측정하는 방법을 살펴보겠습니다. 개요: PyTorch는 사용자가 모델 내의 연산 비용
tutorials.pytorch.kr
사용법 2가지
model의 forward에 profile 호출
import torch.autograd.profiler as profilercontext 사용
from torch.profiler import profile, record_function, ProfilerActivity1. forward 호출
Import
import torch.autograd.profiler as profilerContext manager 사용 - forward 내부
profiler.record('label name') - record label 명을 인자로 전달해준다
class MyModule(nn.Module):
    def __init__(self, in_features: int, out_features: int, bias: bool = True):
        super(MyModule, self).__init__()
        self.linear = nn.Linear(in_features, out_features, bias)

    def forward(self, input, mask):
        with profiler.record_function("LINEAR PASS"):	# 지정하려는 라벨명으로 인자 전달
            out = self.linear(input)

        with profiler.record_function("MASK INDICES"):	# 지정하려는 라벨명으로 인자 전달
            threshold = out.sum(axis=1).mean().item()
            hi_idx = np.argwhere(mask.cpu().numpy() > threshold)
            hi_idx = torch.from_numpy(hi_idx).cuda()

        return out, hi_idx
CUDA warm-up
정확한 성능 벤치마킹을 보장하기위해서 먼저 cuda를 사용해준다
# warm-up
model(input, mask)

with profiler.profile(with_stack=True, profile_memory=True) as prof:
    out, idx = model(input, mask)	# profiling
결과 출력
print(prof.key_averages(group_by_stack_n=5).\ #	operation과 최근 5개의 traceback
                        	table(
                                    sort_by='self_cpu_time_total',	# 정렬 key
                                    row_limit=5))	# 출력 갯수 제한

# 출력 예시

"""
(Some columns are omitted)

-------------  ------------  ------------  ------------  ---------------------------------
         Name    Self CPU %      Self CPU  Self CPU Mem   Source Location
-------------  ------------  ------------  ------------  ---------------------------------
 MASK INDICES        87.88%        5.212s    -953.67 Mb  /mnt/xarfuse/.../torch/au
                                                         <ipython-input-...>(10): forward
                                                         /mnt/xarfuse/.../torch/nn
                                                         <ipython-input-...>(9): <module>
                                                         /mnt/xarfuse/.../IPython/

  aten::copy_        12.07%     715.848ms           0 b  <ipython-input-...>(12): forward
                                                         /mnt/xarfuse/.../torch/nn
                                                         <ipython-input-...>(9): <module>
                                                         /mnt/xarfuse/.../IPython/
                                                         /mnt/xarfuse/.../IPython/

  LINEAR PASS         0.01%     350.151us         -20 b  /mnt/xarfuse/.../torch/au
                                                         <ipython-input-...>(7): forward
                                                         /mnt/xarfuse/.../torch/nn
                                                         <ipython-input-...>(9): <module>
                                                         /mnt/xarfuse/.../IPython/

  aten::addmm         0.00%     293.342us           0 b  /mnt/xarfuse/.../torch/nn
                                                         /mnt/xarfuse/.../torch/nn
                                                         /mnt/xarfuse/.../torch/nn
                                                         <ipython-input-...>(8): forward
                                                         /mnt/xarfuse/.../torch/nn

   aten::mean         0.00%     235.095us           0 b  <ipython-input-...>(11): forward
                                                         /mnt/xarfuse/.../torch/nn
                                                         <ipython-input-...>(9): <module>
                                                         /mnt/xarfuse/.../IPython/
                                                         /mnt/xarfuse/.../IPython/

-----------------------------  ------------  ---------- ----------------------------------
Self CPU time total: 5.931s

"""
성능 개선 - 시간, 메모리
출력의 가장 상단에 있는(메모리, 시간이 큰) 연산부터 개선하여 모델의 병목현상 제거 등 최적화를 진행한다
2. context manager 사용
from torch.profiler import profile, record_function, ProfilerActivity

with profile(activities=[ProfilerActivity.CPU], record_shapes=True) as prof:
    with record_function("model_inference"):
        model(inputs)


# activities = [ProfilerActivity.CPU, ProfilerActivity.CUDA]
# record_shape : input shape 기록 여부
# record_function : 라벨명 전달
출력
table key =
cpu_time_total,
self_cpu_time_total
cuda_time_total,
self_cuda_time_total
cpu time 확인
print(prof.key_averages().table(sort_by="cpu_time_total", row_limit=10)) # 좌
print(prof.key_averages(group_by_input_shape=True).table(sort_by="cpu_time_total", row_limit=10)) # 우 |
 |
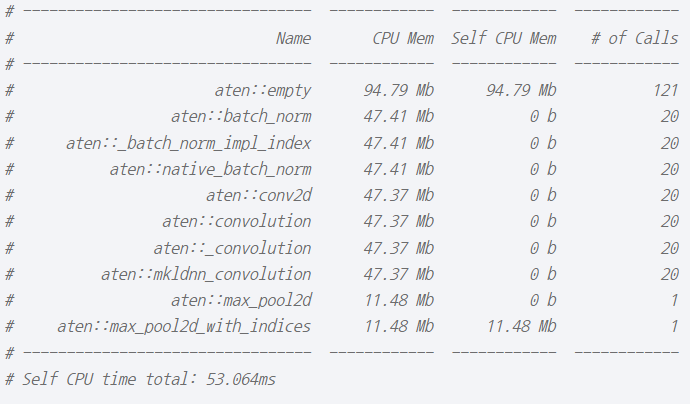
memory 확인
print(prof.key_averages().table(sort_by="self_cpu_memory_usage", row_limit=10)) # 좌
print(prof.key_averages().table(sort_by="cpu_memory_usage", row_limit=10)) # 우 |
 |
Chrome 출력 - chorme://tracing 에서 출력
prof.export_chrome_trace("trace.json")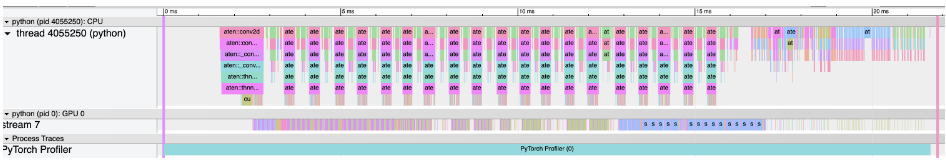
기타 기능
파일 저장
prof.export_stacks("/tmp/profiler_stacks.txt", "self_cuda_time_total")스케쥴링 - train 중 특정 epoch에서 기록할때
from torch.profiler import schedule

my_schedule = schedule(
    skip_first=10,
    wait=5,
    warmup=1,
    active=3,
    repeat=2)

def trace_handler(p):
    output = p.key_averages().table(sort_by="self_cuda_time_total", row_limit=10)
    print(output)
    p.export_chrome_trace("/tmp/trace_" + str(p.step_num) + ".json")

with profile(
    activities=[ProfilerActivity.CPU, ProfilerActivity.CUDA],
    schedule= my_schedule,		# my_schedule 전달
    on_trace_ready=trace_handler	# handler 전달
) as p:
    for idx in range(8):
        model(inputs)
        p.step()
'AI > Pytorch' 카테고리의 다른 글
| Pytorch Reproductibility 설정 (0) | 2022.09.22 |
|---|---|
| torch 분산 학습 (0) | 2022.09.17 |